
Inflated Expectations…Part 2
By: Steven Higgins, Financial Advisor, Principal

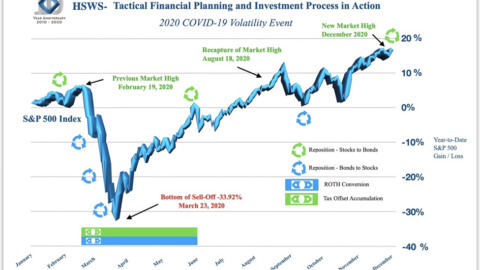
A long long time ago…in 2017, we here at Higgins & Schmidt told tales of inflation to come. We explained how inflation could erode the purchasing power of a retirement portfolio and we wrote articles, made videos, and gave presentations…lots of them. The base case was that the money supply had increased, inflation is cyclical, the labor market was tightening, and labor cost was increasing. And all of those things happened – until the pandemic, of course. We told people to reduce the duration of their bond portfolios, buy stocks and real estate, and prepare for volatility. Those things all checked out as well. The stock market as measured by the S&P 500 has a total return of over 86% and the Case-Schiller National Home Price Index is up over 28% since our first inflation article in March of 2017. Oh and the volatility…we saw a 20% correction in December of 2018 and the COVID-19 panic induced the fastest 30% correction in history in March of 2020.* And here begins – or continues – the story of inflation.
Inflation has always been part of the long-term economic narrative; however, for the entirety of this century it has been a seemingly absent element. So much so, that very few people have any experience dealing with the realities of managing wealth during an inflationary environment. While repeated administrations have strived for the Goldilocks target of 3% inflation, none have achieved the mark with any sustainability. The Great Financial Crisis of 2008-2013 brought unprecedented levels of stimulus and increases to money supply, but the delivery mechanism of the capital itself failed to achieve the desired result, leaving most of the cash sitting on the balance sheets of banks. The COVID-19 pandemic response, however, bypassed nearly all of the previous road blocks by sending trillions of dollars directly to individuals and businesses through several stimulus packages and support programs. And there is likely more to come. The result, the US money supply measured by M2, also known as “near cash”– think cash, CDs, money markets, etc. – is now $20 trillion compared to $15 trillion just before the pandemic. For context, the US money supply (M2) was less than $5 trillion in the year 2000. The money supply in the US has increased by 300% since the year 2000. Over the same time frame the US economy measured by the Gross Domestic Product (GDP) has grown from $10 trillion to $22 trillion or 120%.* The most simple recipe for inflation is more money chasing fewer goods and services. … This situation is that definition.
So, this is where people often take the inappropriate leap of using words like hyperinflation and start comparing the US to Argentina and Zimbabwe. Hyperinflation is an economic term and the widely accepted definition is a period of inflation of over 50% per month and it’s often measured at over 1000% per year. We are having a mature conversation about the potential impact of increased levels of inflation over time on financial plans and expectations for retirees and pre-retirees. Inflation doesn’t have to be extreme to be a challenge. For the unprepared investor or reactionary investor, inflation and the soon-to-follow interest rate increases and market volatility can knock you squarely off track and permanently change your plans and ability to meet your goals.
So, we are clearly talking about realistic levels of inflation and not the violent Game of Thrones version of financial planning that day time business channel commercials and newsletters would portray. In that spirit, here are the most important elements that we as wealth managers and financial planners are focused on as we help our clients prepare for what’s next.
1.) Inflation means prices are going up. Investors should lock in cost as much as possible. For example, today’s low interest rates are great for locking in a large portion of housing expenses.
2.) There are some asset classes that historically not only positively correlate to inflation but are more likely to retain the inflated values over time. The two most accessible to investors are high quality stock portfolios and real estate.
3.) Protect the liquidity you need. However, don’t keep more than you need in cash or fixed type investments. Ideally our clients who are using their investment portfolios for income will have 3-5 years of income reserves in cash or short term bonds. Having more than that can seriously jeopardize an investor’s ability to keep up with rising costs. What people often consider “safe” investments can be the most challenged when facing inflation. *Make sure you are working with a qualified financial advisor when determining what is “safe” for you and what your own income and allocations should be.
4.) Expect volatility, embrace volatility, and know that it is normal. Especially following an economic horror show like the spring of 2020, people can get pretty nervous at the return of volatility. As inflation goes, interest rates follow. The markets will have to reconcile the ever-changing landscape of economics, policies, tax law changes, etc. The gyrations we are bound to feel are normal.
5.) Be patient, have a plan, and follow the process. This would be the Higgins & Schmidt mantra if there was one. This takes time and we are prepared.
So, remember in 2017, my partner Allison Schmidt and I pounded the inflation drum. I had the great idea to create a chart with an illustration of a Starbucks latte. I was showing the impacts of inflation on spending power erosion using something as simple as a cup of coffee. Well, four years later I found the national average of a Starbucks latte to be exactly the same today as it was then. Now to be fair we told you to weather the storm with stocks and real-estate but I’ll be damned if I have been asked about the cup of coffee more than just a few times. Good for you, your coffee is still “only” $4.15. I’m pretty sure I remember that being free with a fill up.
*Financial Sources: www.ycharts.com
The content is developed from sources believed to be providing accurate information. The information in this material is not intended as tax or legal advice. Please consult legal or tax professionals for specific information regarding your individual situation. The opinions voiced in this material are for general information only and are not intended to provide specific advice or recommendations for any individual. All performance referenced is historical and is no guarantee of future results. All indices are unmanaged and may not be invested into directly. The opinions expressed in this material do not necessarily reflect the views of LPL Financial. The economic forecasts set forth in this material may not develop as predicted and there can be no guarantee that strategies promoted will be successful. This is a hypothetical example and is not representative of any specific situation. Your results will vary. The hypothetical rates of return used do not reflect the deduction of fees and charges inherent to investing. There is no guarantee that a diversified portfolio will enhance overall returns or outperform a non-diversified portfolio. Diversification does not protect against market risk. The prices of small and mid-cap stocks are generally more volatile that large cap stocks. Stock investing involves risk including loss of principal. Bonds are subject to market and interest rate risk if sold prior to maturity. Bond values will decline as interest risk if sold prior to maturity. Bond values will decline as interest rates rise and bonds are subject to availability and change in price. Fixed annuities are long-term investment vehicles designed for retirement purposes. Gains from tax-deferred investments are taxable as ordinary income upon withdrawal. Guarantees are based on the claims paying ability of the issuing company. Withdrawals made prior to age 59 are subject to a 10% IRA penalty tax and surrender charges may apply. The Standard & Poor’s 500 Index is a capitalization weighted index of 500 stocks designed to measure performance of the broad domestic economy through changes in the aggregate market value of 500 stocks representing all major industries. The Dow Jones Industrial Average is comprised of 30 stocks that are major factors in their industries and widely held by individuals and institutional investors.

